Findings¶
Every number on this page comes from the repository's own experiment pipeline
(paper/experiments/), at 10 seeds per cell under the fixed-epoch
protocol. Nothing here is illustrative.
The headline result is a negative one, and it is stated first on purpose: ten categories are not enough evidence to order four general-purpose architectures. A benchmark that reported only the means would have declared a winner anyway.
One protocol, ten categories¶
One representative dataset per category, all four general-purpose encoders. Values are mean ± Student's-t CI half-width, higher is better throughout. Bold blue is the best cell in the row; italic marks a model whose interval overlaps the best one, so the two are not distinguishable. Task tags: NC node classification and GC graph classification, both scored by accuracy; LP link prediction, scored by AUC.
| Category | Dataset | GCN | GAT | SAGE | GT |
|---|---|---|---|---|---|
| Combinatorial | TSP-random · LP | 0.864 ± 0.025 | 0.832 ± 0.028 | 0.890 ± 0.023 | 0.872 ± 0.019 |
| Biology | MUTAG · GC † | 0.705 ± 0.060 | 0.637 ± 0.038 | 0.700 ± 0.060 | 0.721 ± 0.050 |
| Social | Cora · NC | 0.811 ± 0.001 | 0.797 ± 0.009 | 0.799 ± 0.004 | 0.792 ± 0.004 |
| Knowledge | FB15k-237 · LP | 0.675 ± 0.008 | 0.523 ± 0.008 | 0.572 ± 0.027 | 0.537 ± 0.008 |
| Infrastructure | Euroroad · LP | 0.524 ± 0.019 | 0.593 ± 0.022 | 0.540 ± 0.028 | 0.519 ± 0.042 |
| Finance | Board-directors · LP | 0.968 ± 0.007 | 0.989 ± 0.002 | 0.901 ± 0.012 | 0.853 ± 0.015 |
| Computing | Internet AS · LP | 0.967 ± 0.001 | 0.655 ± 0.013 | 0.745 ± 0.013 | 0.598 ± 0.068 |
| Vision | MNIST-superpixels · GC † | 0.105 ± 0.011 | 0.106 ± 0.012 | 0.120 ± 0.021 | 0.142 ± 0.027 |
| Physics | Ising-lattice · LP | 0.676 ± 0.030 | 0.616 ± 0.034 | 0.630 ± 0.020 | 0.620 ± 0.018 |
| Security | 9/11 terrorists · LP | 0.685 ± 0.096 | 0.738 ± 0.065 | 0.730 ± 0.093 | 0.704 ± 0.081 |
† GIN is defined only for the two graph-classification slots, so it has no value in the other eight rows and is left out of the table. On both rows it beats every model shown: 0.847 ± 0.044 on MUTAG and 0.273 ± 0.049 on MNIST-superpixels.
Read down a column and no architecture wins everywhere: GCN takes four categories, GAT three, GraphTransformer two, GraphSAGE one — and GIN, where it can run at all, takes both. That is the point, and it is exactly what a single-dataset benchmark cannot show you.
What the statistics actually say¶
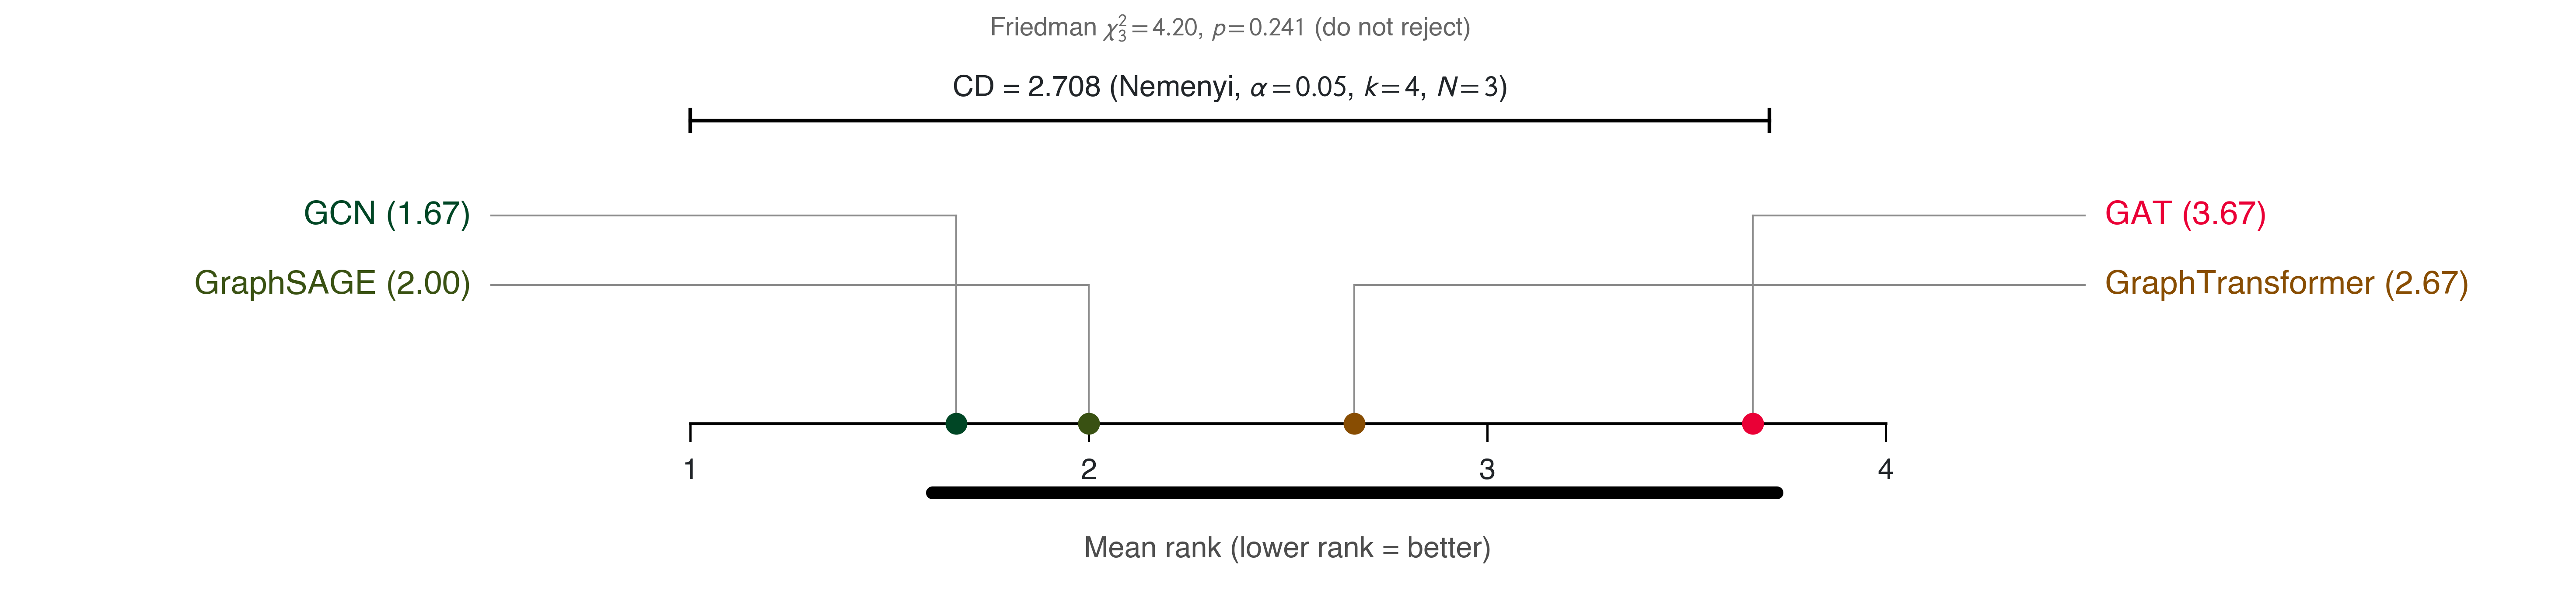
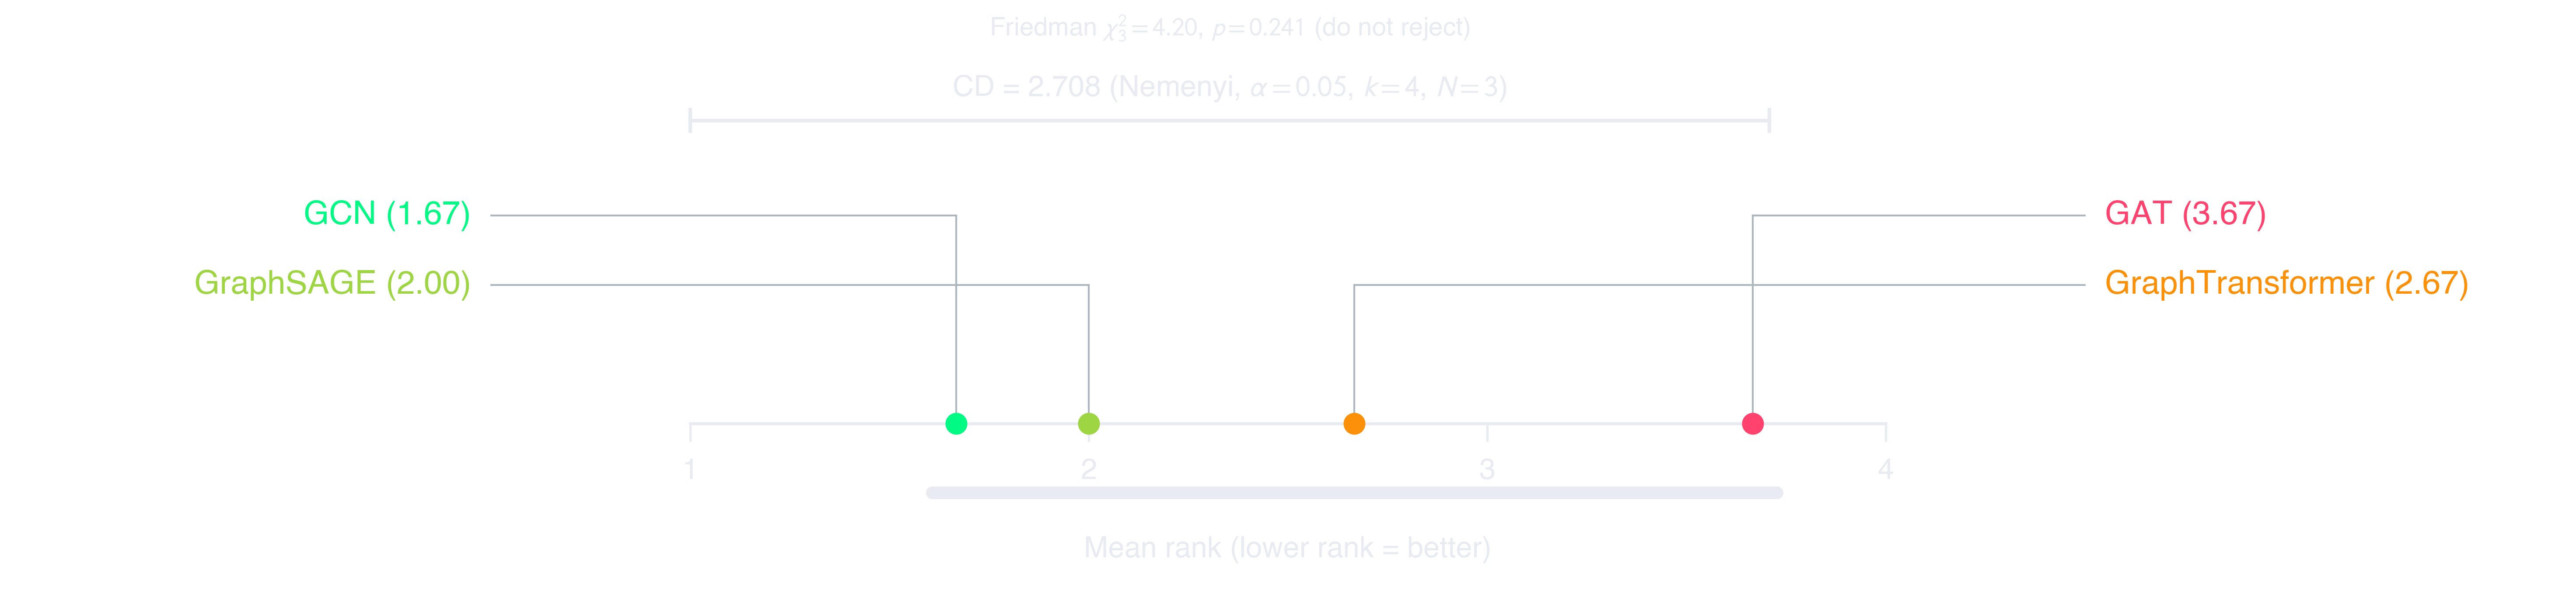
Aggregate the ten per-category rankings and the honest answer is a negative result:
| Friedman omnibus | \(\chi^2_3 = 3.00\), \(p = 0.392\) — do not reject |
| Nemenyi critical difference | \(CD = 1.483\) (\(\alpha = 0.05\), \(k = 4\), \(N = 10\)) |
| Observed mean ranks | GraphSAGE 2.10 · GCN 2.20 · GAT 2.80 · GraphTransformer 2.90 |
| Largest rank gap | 0.80 — well inside \(CD\) |
| Cliques | one: no architecture separates from any other |
Ten categories are not enough evidence to order these four architectures.
Where differences do appear¶
Zoom in on a single task family and the resolution improves. Node classification on the three Planetoid citation graphs, 10 seeds:
| Model | Cora | CiteSeer | PubMed |
|---|---|---|---|
| GCN | 0.811 ± 0.001 | 0.683 ± 0.002 | 0.791 ± 0.002 |
| GAT | 0.795 ± 0.010 | 0.655 ± 0.013 | 0.752 ± 0.015 |
| GraphSAGE | 0.799 ± 0.004 | 0.683 ± 0.012 | 0.767 ± 0.002 |
| GraphTransformer | 0.792 ± 0.004 | 0.700 ± 0.006 | 0.759 ± 0.006 |
Here 11 of 18 pairwise comparisons survive Holm–Bonferroni correction — a real signal that the cross-category view washes out. Note also that the per-task winner flips: GCN on Cora and PubMed, GraphTransformer on CiteSeer.
Is the evidence sufficient?¶
The report also grades itself. Across the same 18 comparisons:
| Cora | CiteSeer | PubMed | All | |
|---|---|---|---|---|
| Median minimum detectable effect | 0.0114 | 0.0169 | 0.0150 | 0.0137 |
| Comparisons resolved at 10 seeds | 3/6 | ⅚ | 3/6 | 11/18 |
| Seeds needed for a 0.01 gap | 13 | 25 | 23 | 17 |
| Seeds needed for a 0.005 gap | 44 | 93 | 84 | 62 |
And a jackknife over the ten categories shows how fragile the rank ordering is: the six pairwise rank gaps separate in only 0.1 %–11.3 % of task resamples. No pair is stable.
Reading these numbers yourself¶
Every figure and table above is one method call on a BenchmarkReport, and
the reports themselves round-trip through JSON, so a published bundle can be
re-analysed under a different CI method, pairwise test, epoch-selection rule
or task weighting without anyone re-running the training.