graphnetz

Benchmark graph neural networks and get back a statistical report, not a leaderboard.
Why graphnetz
Most GNN benchmarks report one accuracy per cell and name a winner. graphnetz trains every (task, model, seed) triple through one pipeline and answers the questions a reviewer actually asks.
-
Intervals on every cell
Mean and Student's t confidence interval over paired seeds, so a difference comes with its uncertainty attached.
-
Corrected comparisons
Paired t-tests or Wilcoxon signed-rank within each task, Holm-corrected for the number of pairs.
-
Ranks across tasks
Friedman omnibus, Nemenyi critical difference, and the Demšar diagram for the "does it win in general?" question.
-
A report that grades itself
Minimum detectable effect, observed power and equivalence tests say whether a non-significant result means "tied" or "underpowered".
-
One pipeline, four task families
Node and graph classification, graph regression and link prediction. Adapters let node encoders reach every task without a second code path.
-
A catalogue across ten domains
PyG built-ins, OGB and the Netzschleuder archive, from citation graphs to power grids, molecules and connectomes.
From install to report
uv add graphnetz                # core
uv add "graphnetz[ogb]"         # plus the OGB loaders
uv add "graphnetz[chem]"        # plus RDKit, for the molecular loaders
Python 3.10 or newer, with torch ≥ 2.6 and torch-geometric ≥ 2.6. See
Installation for the extras.
from graphnetz import GAT, GCN, GraphSAGE, run_benchmark

report = run_benchmark(
    "social",
    {"GCN": GCN, "GAT": GAT, "GraphSAGE": GraphSAGE},
    seeds=range(10),
    task_type="node_cls",
)
Every compatible (task, model, seed) triple is trained with the same splits, the same seeding and the same epoch budget.
report.summary()       # per-cell mean ± Student's t CI
report.pairwise()      # Holm-corrected paired tests within each task
report.friedman()      # omnibus test on ranks across tasks
report.power()         # what this design could have detected
Every view reads the same X[task, model, seed] tensor. Nothing
downstream retrains. See Reading the report.
report.plot_critical_difference(alpha=0.05)
report.to_latex("results.tex")       # booktabs table, row-best in bold
report.to_json("report.json")        # reload later with from_json
Figures follow single and double column widths and save as vector output. See Figures and tables.
How a run works
-
Catalogue
The category maps to its curated tasks.
-
Encoders
Models that cannot serve a task are dropped.
-
Training
Each triple is reseeded and trained.
-
Statistics
Intervals, paired tests, ranks.
-
Report
One object holds every view.
The benchmark protocol covers each stage in full.
What the evidence says
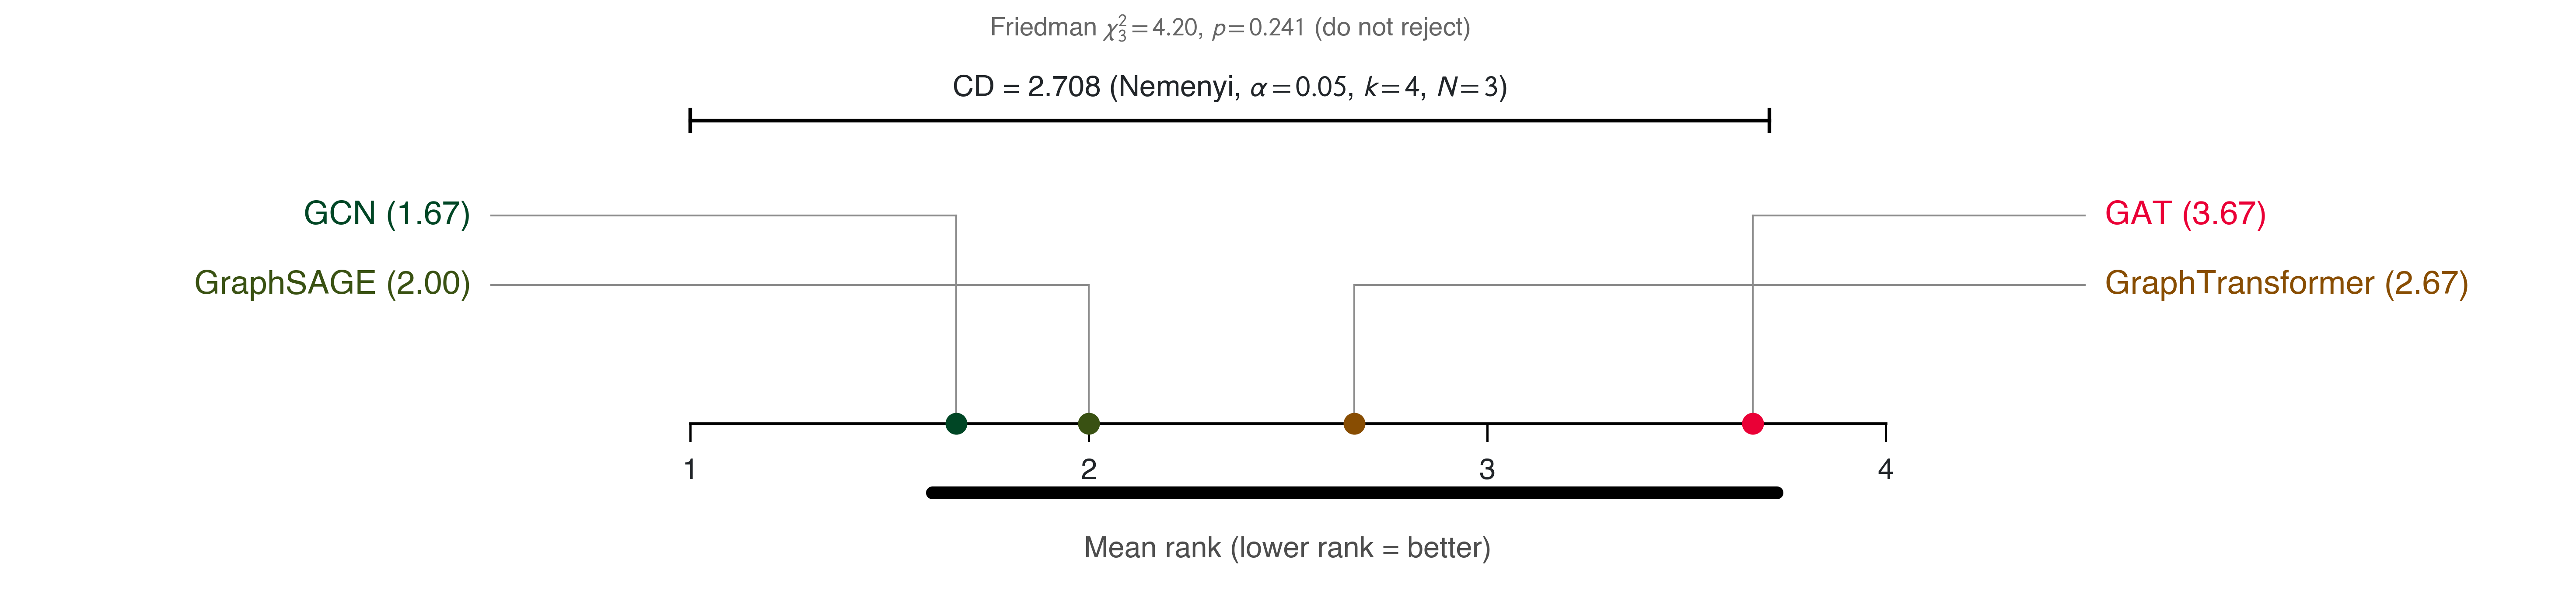
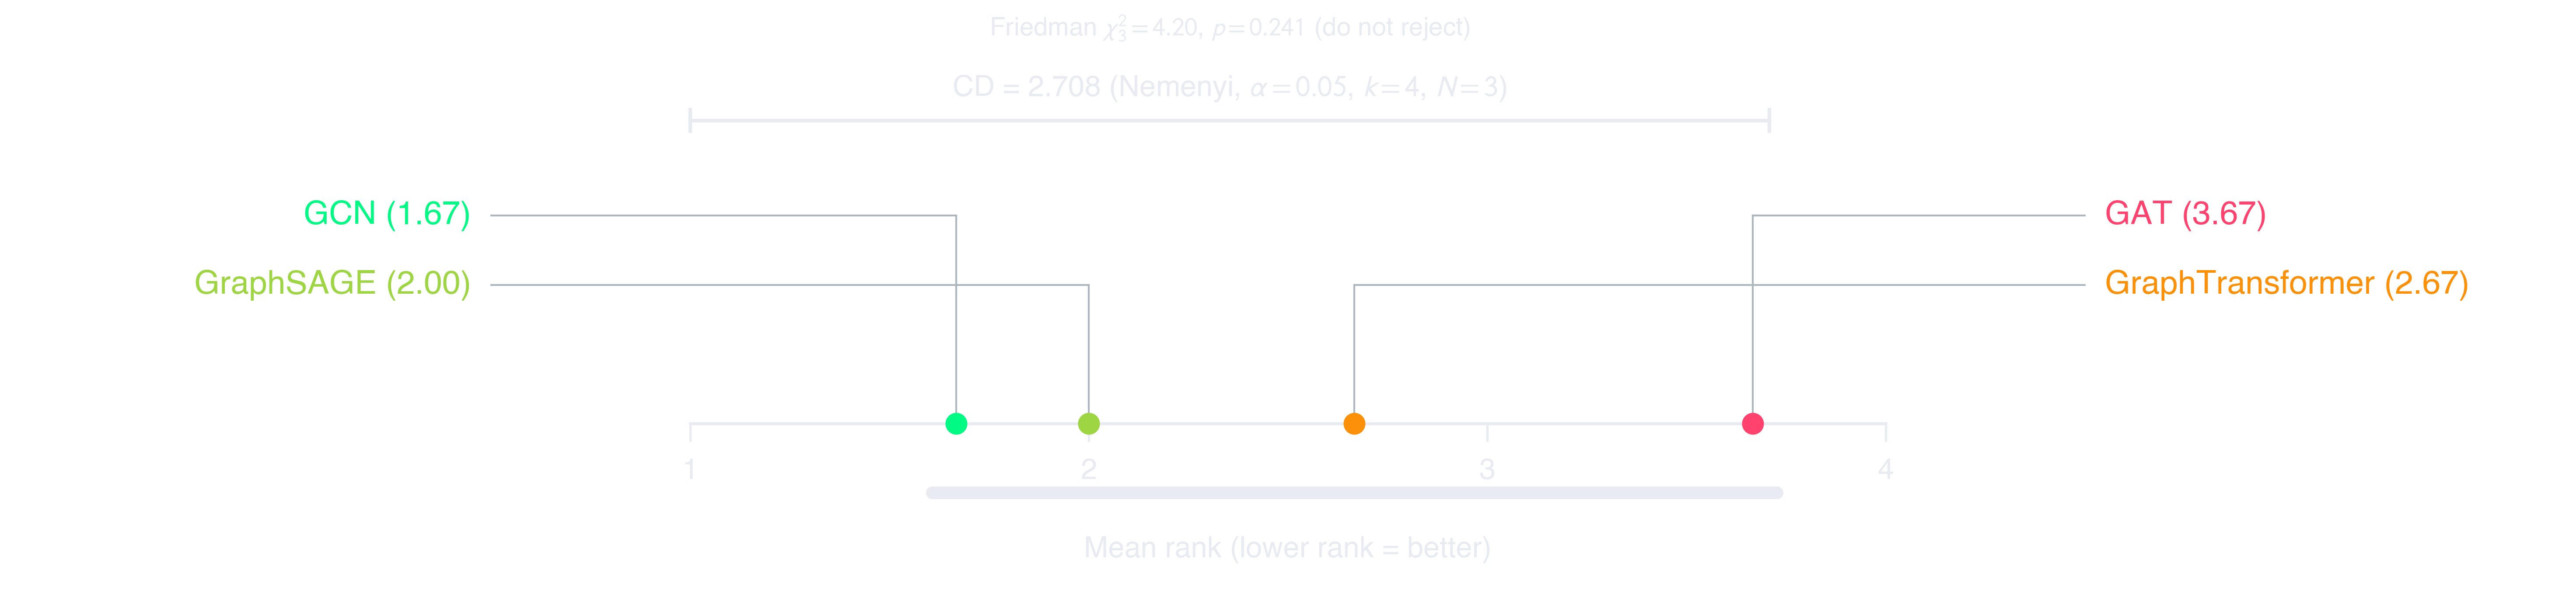
Four general-purpose encoders, one dataset from each of ten categories, ten seeds per cell. The Friedman test does not reject (\(\chi^2_3 = 3.00\), \(p = 0.392\)) and all four sit in one clique.
Ten categories are not enough evidence to order these architectures. A benchmark that reported only the means would have declared a winner anyway.
Models
Six architectures share the same trainers, splits and statistics. What separates them is how a node embedding is computed, not how it is evaluated.
| model | supported tasks | mechanism | reference |
|---|---|---|---|
GCN |
all four | symmetric-normalised neighbour averaging | Kipf & Welling, ICLR 2017 |
GAT |
all four | learned attention over neighbours | Veličković et al., ICLR 2018 |
GIN |
graph_cls, graph_reg |
sum aggregation plus an MLP | Xu et al., ICLR 2019 |
GraphSAGE |
all four | separate self and neighbour transforms | Hamilton et al., NeurIPS 2017 |
GraphTransformer |
all four | multi-head transformer convolution | Shi et al., IJCAI 2021 |
DGI |
(pre-training utility) | mutual-information maximisation | Veličković et al., ICLR 2019 |
Bring your own with a decorator, a class attribute or an inline tuple. See Custom models.
Explore the docs
-
Getting started
Install the right extras, train one model, then run your first multi-seed benchmark.
-
Concepts
Where the intervals come from, which correction applies where, and how to tell a tie from an underpowered test.
-
Guides
The five-stage protocol, the dataset catalogue, every view on the report, and hyperparameter search.
-
API reference
Every public symbol, organised by module, with its docstring and source.